
Visual output
What does pwd equal?
file path to current file
What does filesep equal?
/ for Mos
\ for windows
Plot data
Before we plot anything what must we do?
figure;
This is so that we have something to plot onto
What arguments does the plot function take?
plot(x,y,'lineStyle','marker-type',x1,y1,'lineStyle','marker-type')
plot(y)
In the case above x is assumed to increment by one after each itteration
What are all the lifestyles?
'-', '—', '-.'
What are all the markers?
'+', 'x', '^', 'v', 's', 'o', '*'
How do i add a header?
title('titleName')
How do i add a header to each axis?
xlable('headerName')
ylable('headerName')
What does hold on; do?
This makes it so that the current plots are not wiped from the figure when you do another plot function
How do i set it so that each axis is on the same scale?
axis equal;
How do i set limits on the scale of each axis?
axis([0 1 0 2])
x = 0 to 1
y = 0 to 2
What does legend do?
legend({'firstLinePlotted','secondLinePlotted'},'location', 'southEast')
- first part specifies the names for each line in order that they were plotted
- second part specifies where the legend is located on the graph
Displaying images
- Images can either be stored as 2D arrays or 3D arrays
How does a 2d array display values?
By using a color map, this is simply a scale of colors where one say 'black' represents a low number, and anther 'white' might represent a high number
How does a 3d array display values?
- each slice is interpreted as red, green, blue
- if it is stored as a double values must lie in the range 0 to 1
- if it is stored as a unit8, values must lie in the rage 0 to 255
What is the jet colormap?
jet 256 colors
this is all the colours in the rainbow
What does image(a) do?
- This will display the image matrix a
- It will resize the image to fit
- jet is the colormap, cannot be changed
- only excepts doubles
What does imagesc(a) do?
This rescales the image colors so that it fits the colormap
What does imshow(a) do?
colormap is default to gray 256 colors
maintains aspect ratio
How do i change the colormap?
colormap gray;
How do i make it so that the image scales correctly?
axis image
How do we plot on an image?
By using the hold on operator
How to we display text on a figure?
text(x, y, 'text to be displayed');
How is the figure made?
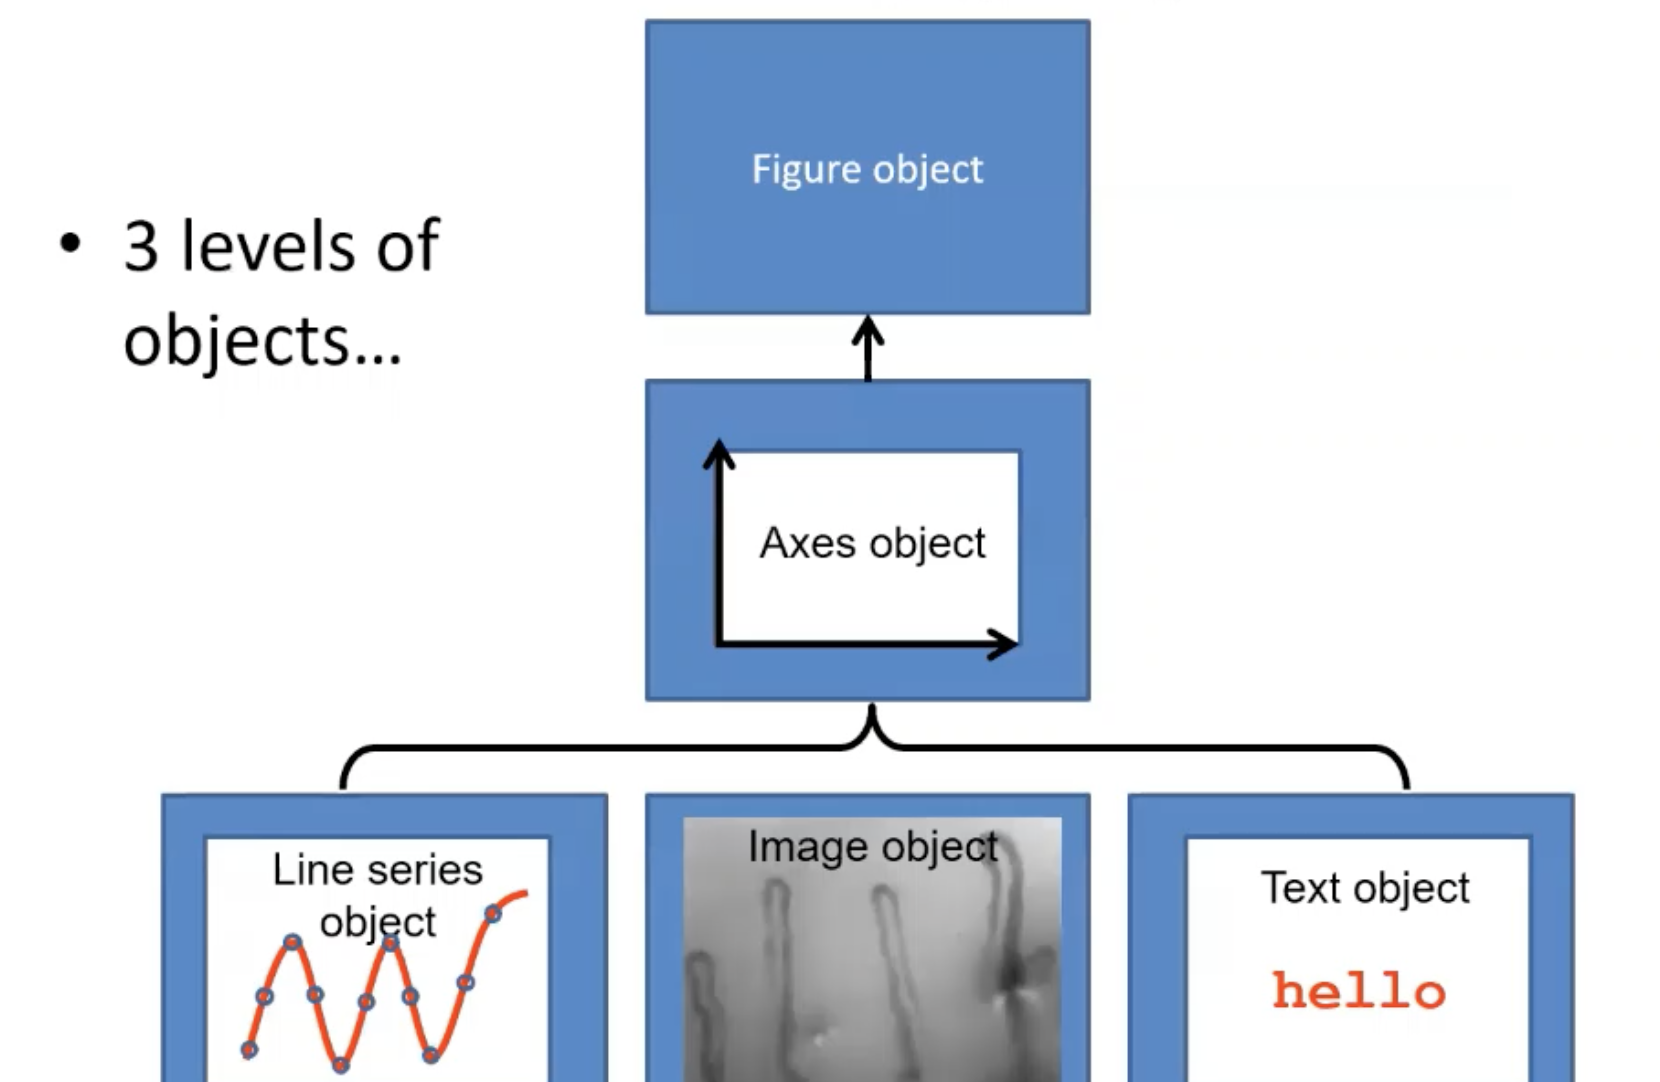
What does gcf and gca return?
the current figure
the current axis
Handles
What is a handle?
It is a unique identifier for a object
How do i define a handle?
f1 = figure;
a1 = axis;