Numpy codecademy
Array
Note: we use numpy arrays, cos they can have element-wise operations (does same thing to every element)
myList = [1,2,3]
arr = np.array(myList)
2D ARRAY
np.array([[92, 94, 88, 91, 87],
          [79, 100, 86, 93, 91],
          [87, 85, 72, 90, 92]])

# the following will error

np.array([[29, 49,  6],
          [77,  1]])
#this is because both each list is a diffrent length

np.array([68, 16, 73],
         [61, 79, 30])
#this will not run because they are not enclosed in []
ARRAY SELECTION (on a toggle since is easy)
# --1D ARRAY--
# first element
a[0]

# last element
a[-1]

# select a group - bar last element (here elements 1 and 2 selected)
a[1:3]

# all elements up to...
a[:3]

# all elements from and including...
a[-3:]

# --2D ARRAY--
# first column
a[:,0]

# first row
a[0,:]

# range on a row
a[0,1:3]
CSV to Array
csvArr = np.genfromtxt('file.csv', delimiter = ',')
# delimiter is whatever seperates the data in the CSV this can be,  tabs or :
Operations
Note: this works with all operations
# With a list NOT NUMPY
l = [1, 2, 3, 4, 5]
l_plus_3 = []
for i in range(len(l)):
    l_plus_3.append(l[i] + 3)

# With an array WITH NUMPY
a = np.array(l)
a_plus_3 = a + 3
ADDING AND SUBTRACTING array with matching length
a = np.array([1, 2, 3, 4, 5])
b = np.array([6, 7, 8, 9, 10])
a + b
Logical Operators with Arrays
>>> a = np.array([10, 2, 2, 4, 5, 3, 9, 8, 9])
>>> a > 5
array([True, False, False, False, False, False, True, True, True], dtype=bool)

# gets a list of elements that fits our critiria
>>> a[a > 5]
array([10, 9, 8, 9, 7])

# works with logic, not each statment must be in ()
>>> a[(a > 5) | (a < 2)]
array([10, 9, 8, 9, 7])
Statistics
Mean
arr_mean = np.mean(arr)
# gives a percentage of conditions that meet the condition  ans = 1-0
Percent_of_condition = np.mean(arr > 20)

# 2d means - output is mean of each row in a new array
# axis = 1 (rows), axis = 0 (columns)
arr_mean = np.mean(arr, axis = 1)
Outliers
# Sort - smallest to biggest
np.sort(arr)
Median
med = np.median(arr)Percentiles
Tells us the value of which N% are below - median is the 50th percentile, 50% of the values are below
Minimum | First Quartile | Medium | Third Quartile | Maximum
| Interquartile Range |
# returns the 40th percentile
np.percentile(arr, 40)
Standard Deviation
Describes is the spread of the data
np.std(arr)Statistical Distributions
Histograms
Bin - this is a range of values, that one column contains
# This imports the plotting package.  We only need to do this once.
from matplotlib import pyplot as plt

# Making data
data = np.array([1, 1, 1, 2, 2, 2, 2, 2, 3, 3, 4, 4, 4, 4, 5])

# Setting bin size, and range of value - dafaults to 10 bins
plt.hist(data, bins=5, range=(1, 6), label='Name of data', histtype='step')

# This displays the histogram
plt.show()
Distribution of data
num of peaks
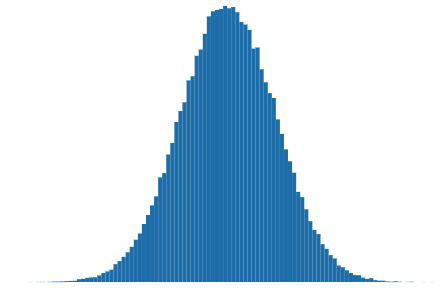
Unimodal Distribution
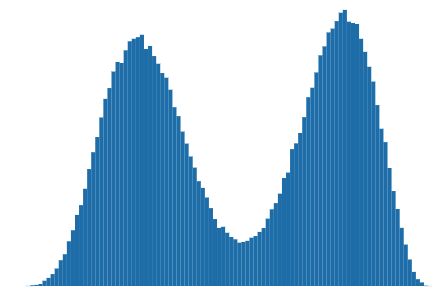
Bimodal Distribution
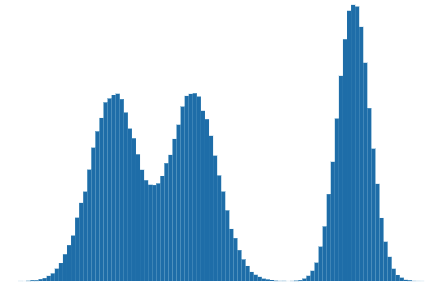
Multimodal Distribution
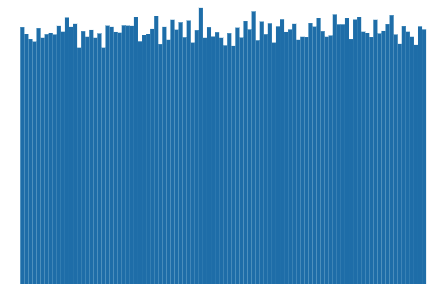
Uniform Distribution
spread of data
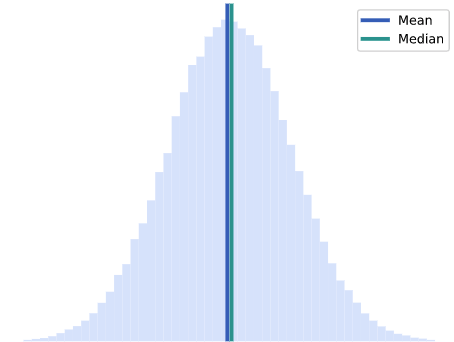
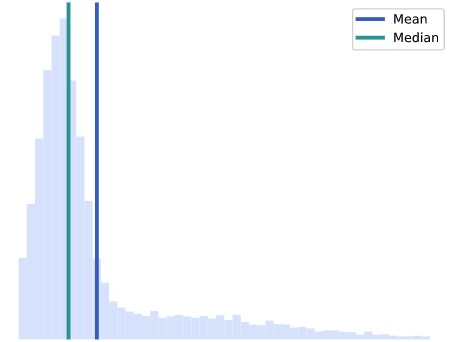
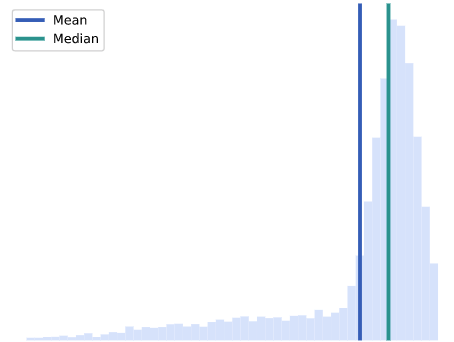
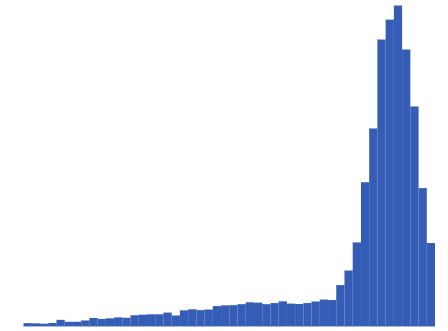
Note: more skew = less useful mean and median
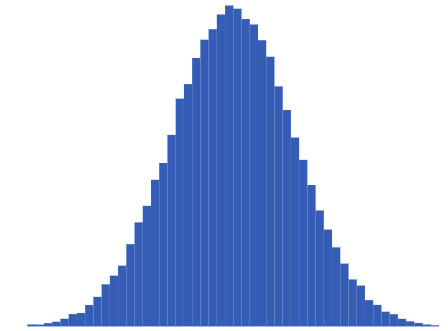
Symmetric
mean / median
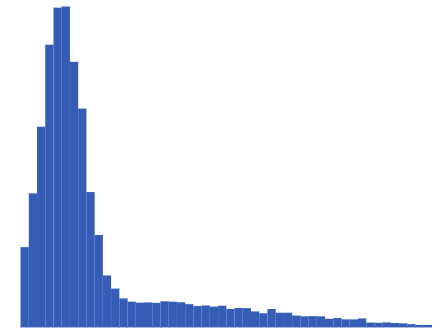
Skew-Right (little data on the right)
mean / median
Skew-Left (little data on the left)
mean / median
Normal distribution
This is a unimodal, symmetric
Loc - the mean
Scale - the standard deviation
Size - number of random num to generate
arr = np.random.normal(loc, scale, size=100000)