# probs need a bigger fig size
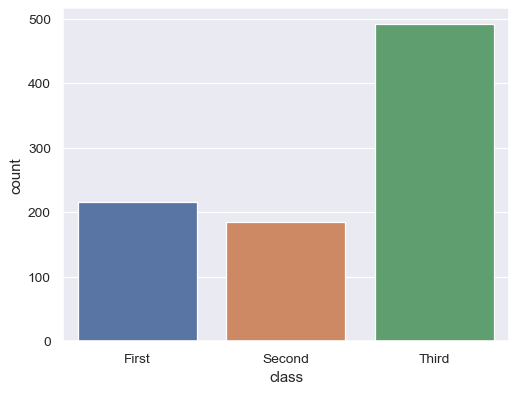
sns.countplot(data=df, x='colName')

# hue='colName'
# palette=colorMap, google it

# ylabel='title'

#df['colName'].value_count(), might be handy
Barplot
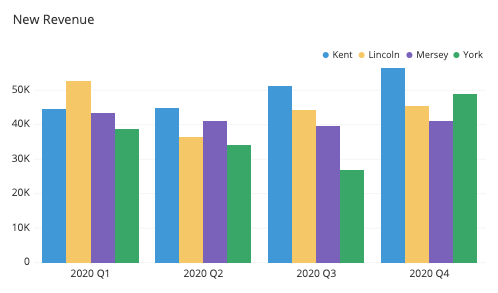
sns.barplot(data=df, x='colName', y='colName', estimator=np.mean, ci='sd')
# avg y per catagory x, with a standard diviation shown
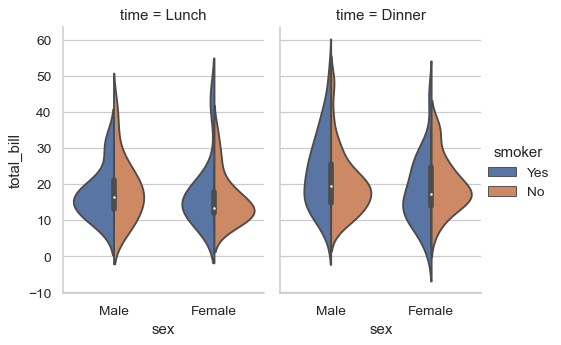
sns.violinplot(data=df, y='colName', x='colName')

# hue=colName, split=True(this part only works with 2)

# inner='quartile'

# bw=0.5, change sensitivity
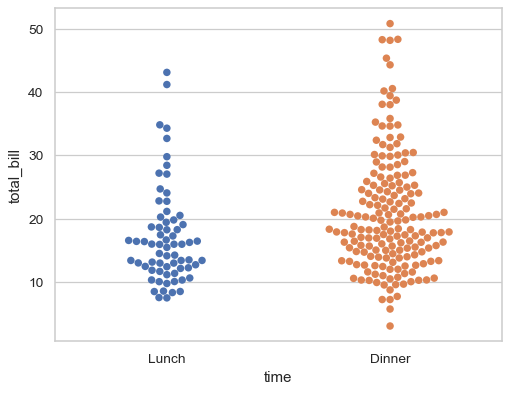
Swarmplot
sns.swarmplot(data=df, y='colName', x='colName')

# size=2, mark size