Comparison Plots
Jointplot
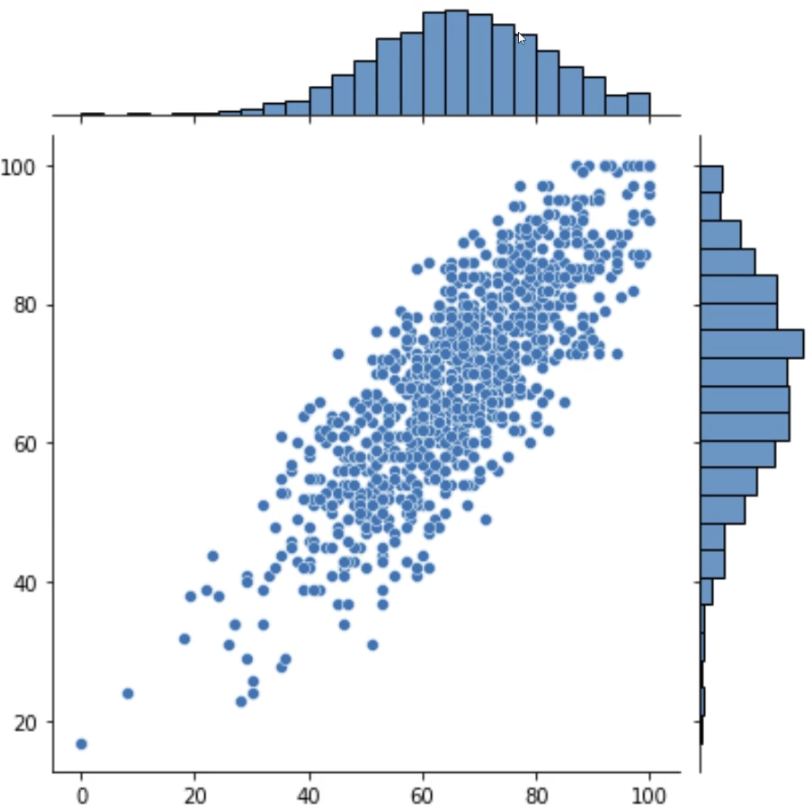
sns.jointplot(data=df, x='colName', y='colName')

# kind='hex', or 'hist' or
# kind='kde', shade=True
Pairplot
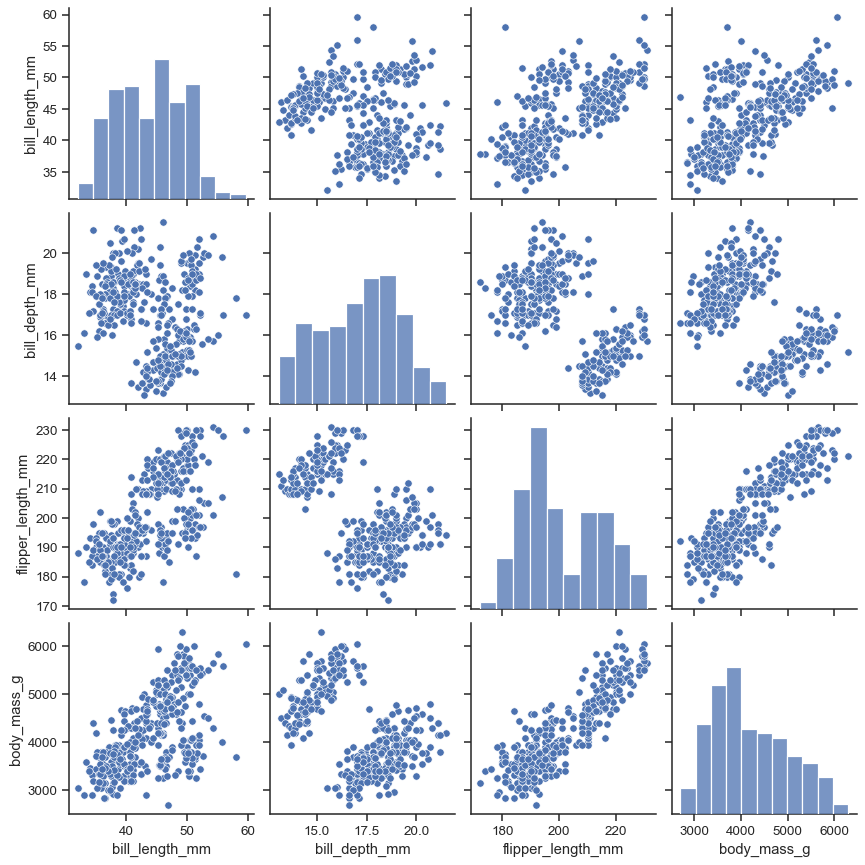
sns.pairplot(data=df)

# diag_kind='hist' or 'kde'

# corner=True, removes duplicates
sns.jointplot(data=df, x='colName', y='colName')
# kind='hex', or 'hist' or
# kind='kde', shade=True
sns.pairplot(data=df)
# diag_kind='hist' or 'kde'
# corner=True, removes duplicates