Distribution Plots
Rug
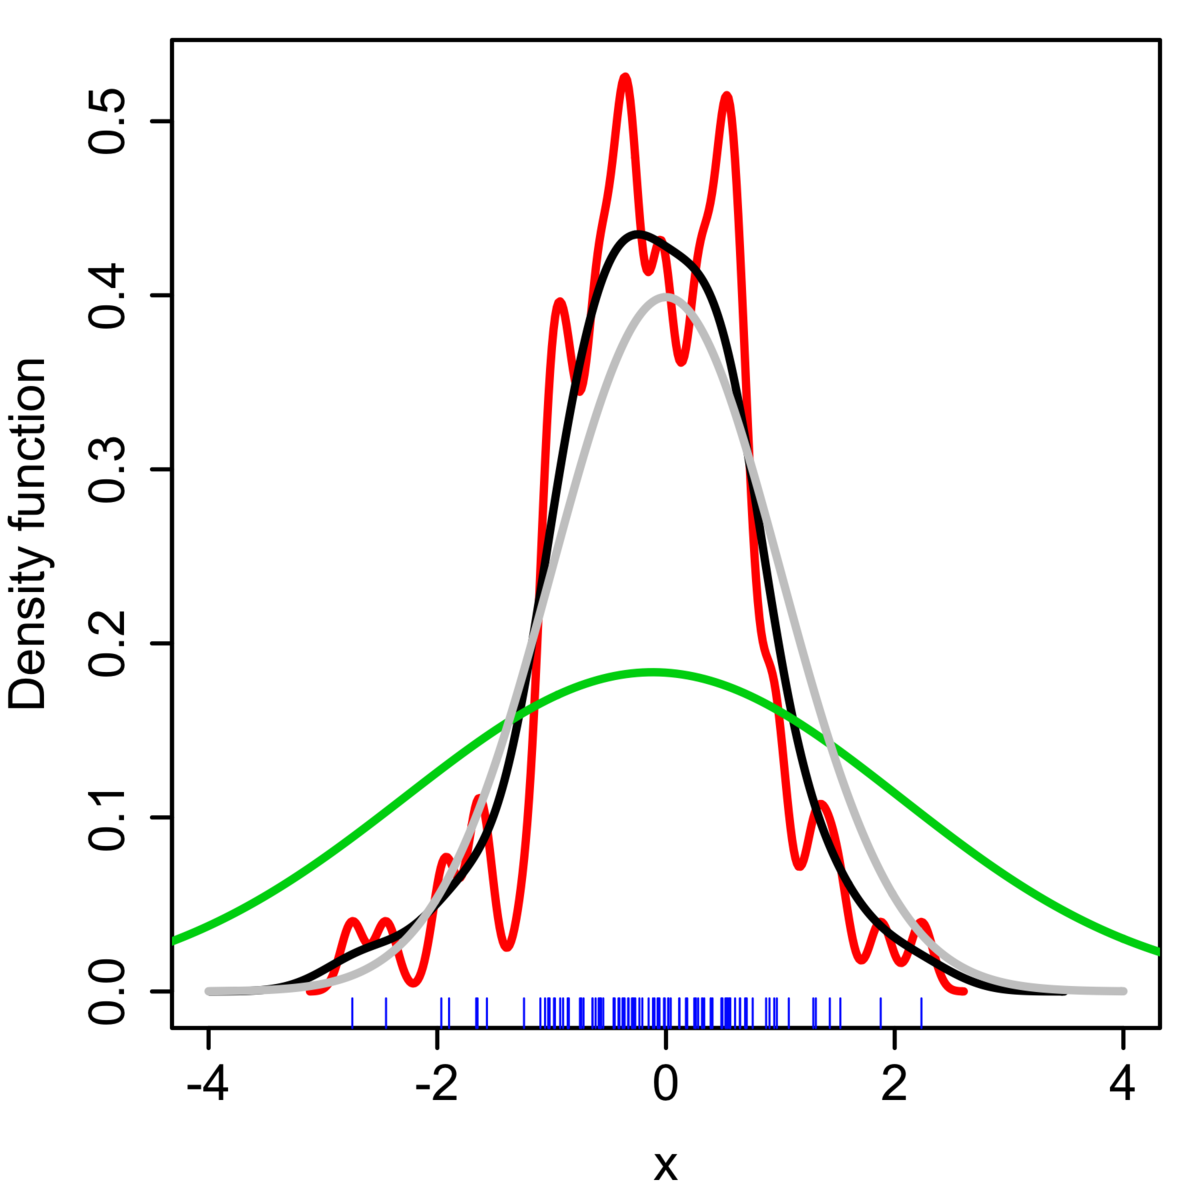
sns.rugplot(x='colName', data=df)

# height=0.5, 50% of the y axis
Histogram
# DO NOT USE DISTPLOT
sns.displot(x='colName', data=df, bins=10)

sns.displot(x='colName', data=df, kde=True, rug=True)
KDE plot curve
sns.kdeplot(x='colName', data=df)

# clip=[0,100], min and max

# bw_adjust=0.01, how sensitive it is to variance

# shade=True, colors in underneath it