Seaborn Grids
Catplot
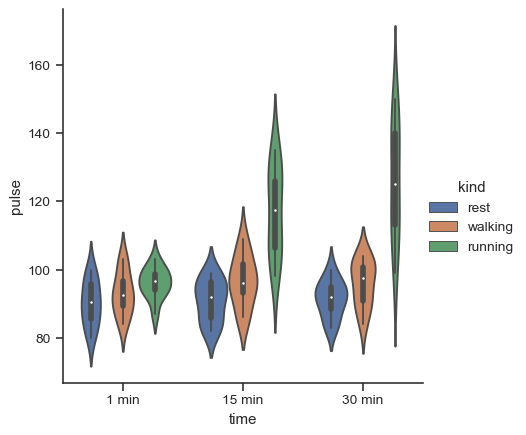
sns.catplot(data=df, x='colName', y='colName', kind='box',

row='anotherColName', col='anotherColName')

# creates new table for each anotherColNamesns.catplot(data=df, x='colName', y='colName', kind='box',
row='anotherColName', col='anotherColName')
# creates new table for each anotherColName