Operating System Debugging
Debugging - finding and fixing errors or bugs
- OS has a log file, which stores error information
- In the case of Application failure, a core dump file is made, storing the memory of the process
- In the case of Kernel failure, a cache dump file is made, storing the memory of the kernal
Performance Tuning
Optimise the performance of a program
How
- Tracing Listing, use for analysis
- Profiling is when you look at a pointer and look for trends
To look for
- Bottlenecks - do this by looking at system operations
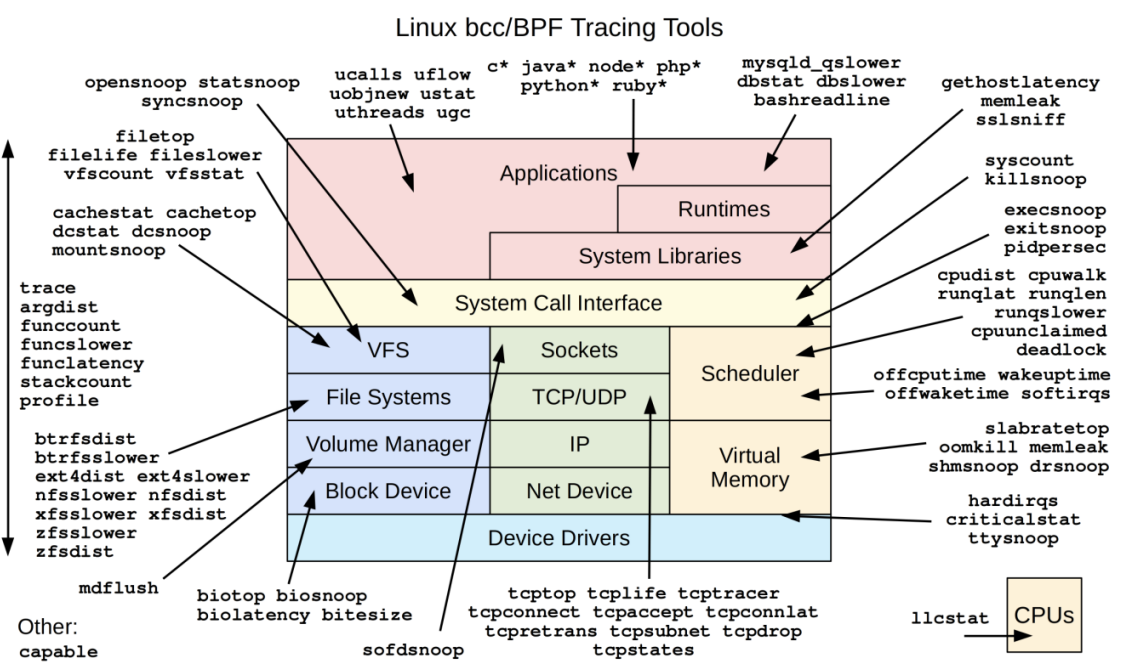
Tracing
Example of a tracing tool with linux is 'BCC'
- strace – trace system calls invoked by a process
- gdb – source-level debugger
- valgrind – detect many memory management and threading bugs
- perf – collection of Linux performance tools
- tcpdump – collects network packets